Reflection
This project exemplified how design can transform advanced analytics into everyday decision-making tools.
By combining data transparency, interactivity, and human-centered design, I helped Air Canada’s teams move from static forecasting models to a living, adaptive decision platform, one where users could visualize not just what might happen, but why.
Role: Product Designer (Lead)
Focus: Predictive Analytics | AI/ML Interface Design | Data Visualization | Human-Centered Forecasting Tools
Project Overview
Air Canada’s Network Planning and Revenue Management teams needed a data-driven forecasting application capable of predicting passenger demand across routes, seasons, and regions.
The goal was to design an AI-powered econometric forecasting tool that would help analysts, planners, and executives simulate future demand scenarios based on variables such as fuel prices, GDP growth, exchange rates, travel restrictions, and historical booking trends.
This was part of Air Canada’s broader initiative to modernize its AI and decision-support ecosystem, blending machine intelligence with intuitive design to empower data-driven network planning and profitability optimization.
The Challenge
Forecasting airline demand requires modeling thousands of dynamic factors , economic indicators, consumer behavior, capacity constraints, and competitor movements.
While data scientists could generate powerful econometric models, planners often lacked a usable, visual interface to explore and interpret these insights effectively.
I was tasked with designing an experience that made complex statistical forecasts accessible, explainable, and actionable for non-technical business users.
Key challenges included:
- Translating econometric model outputs into understandable visualizations.
- Balancing data density with usability across large tables, charts, and simulation tools.
- Ensuring the interface supported scenario modeling and “what-if” forecasting without requiring technical expertise.
- Designing for trust and transparency, helping users understand why forecasts changed based on economic assumptions.
My Role & Contributions
As the Lead Product Designer, I defined the product vision, user experience, and design system integration for the forecasting interface, from discovery to delivery.
1. Discovery & Research
- Partnered with data scientists, revenue analysts, and network planners to map the existing forecasting process — a mix of Excel models, legacy BI dashboards, and manual reports.
- Conducted contextual interviews with planners to understand workflow bottlenecks, decision cadence, and collaboration needs.
- Documented the end-to-end process in a service blueprint, mapping data sources, transformation steps, and stakeholder touchpoints.
2. Experience Strategy
- Defined the design goal: make statistical forecasting intuitive and explainable.
- Created personas representing analyst and executive roles, highlighting the difference between exploratory and summary-level use cases.
- Prioritized three core user outcomes:
- Quickly assess passenger demand changes.
- Understand the drivers behind forecast shifts.
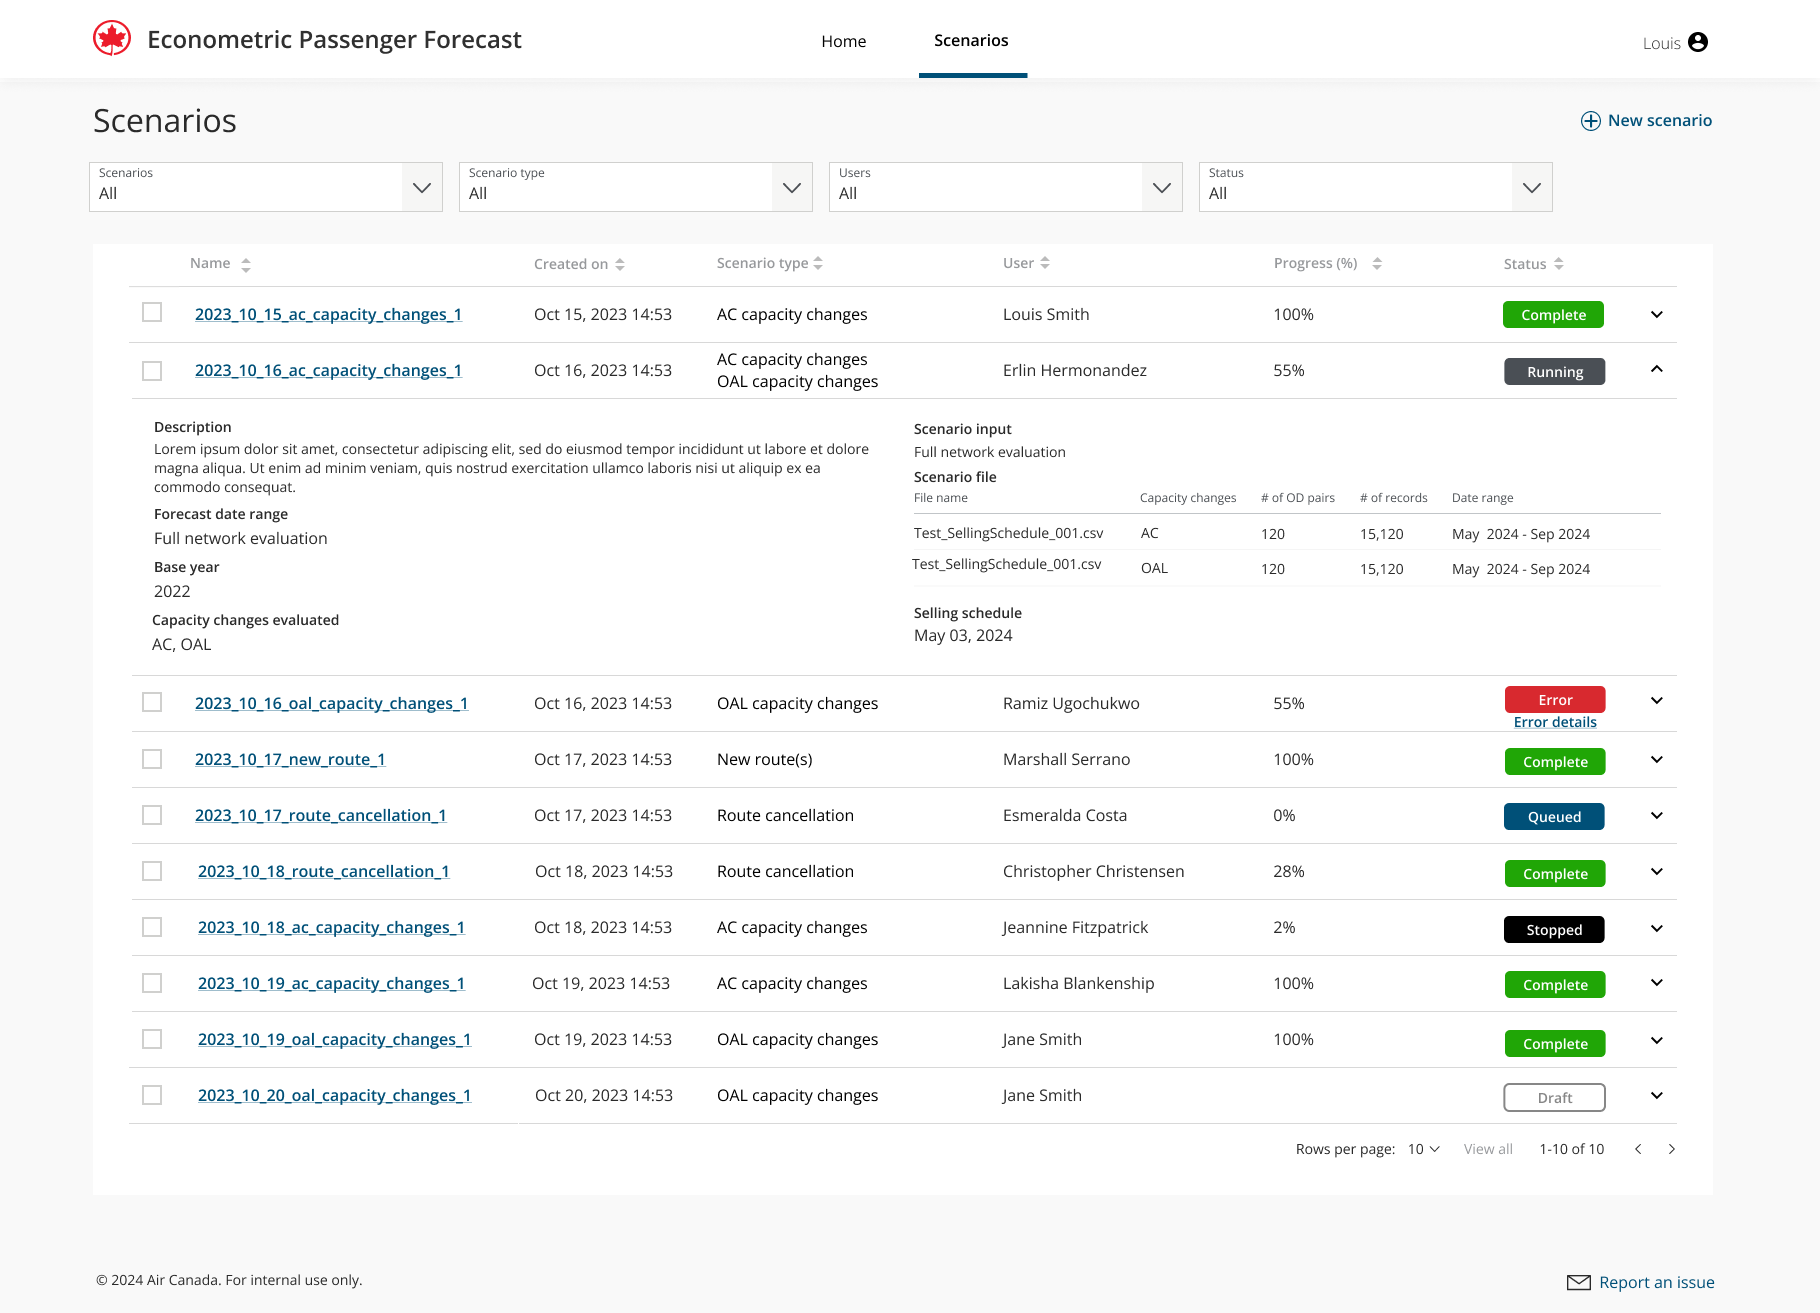
- Simulate what-if scenarios to test business assumptions.
3. Design & Interaction Model
Tools: Figma • FigJam • Miro • Power BI Integration • Azure ML
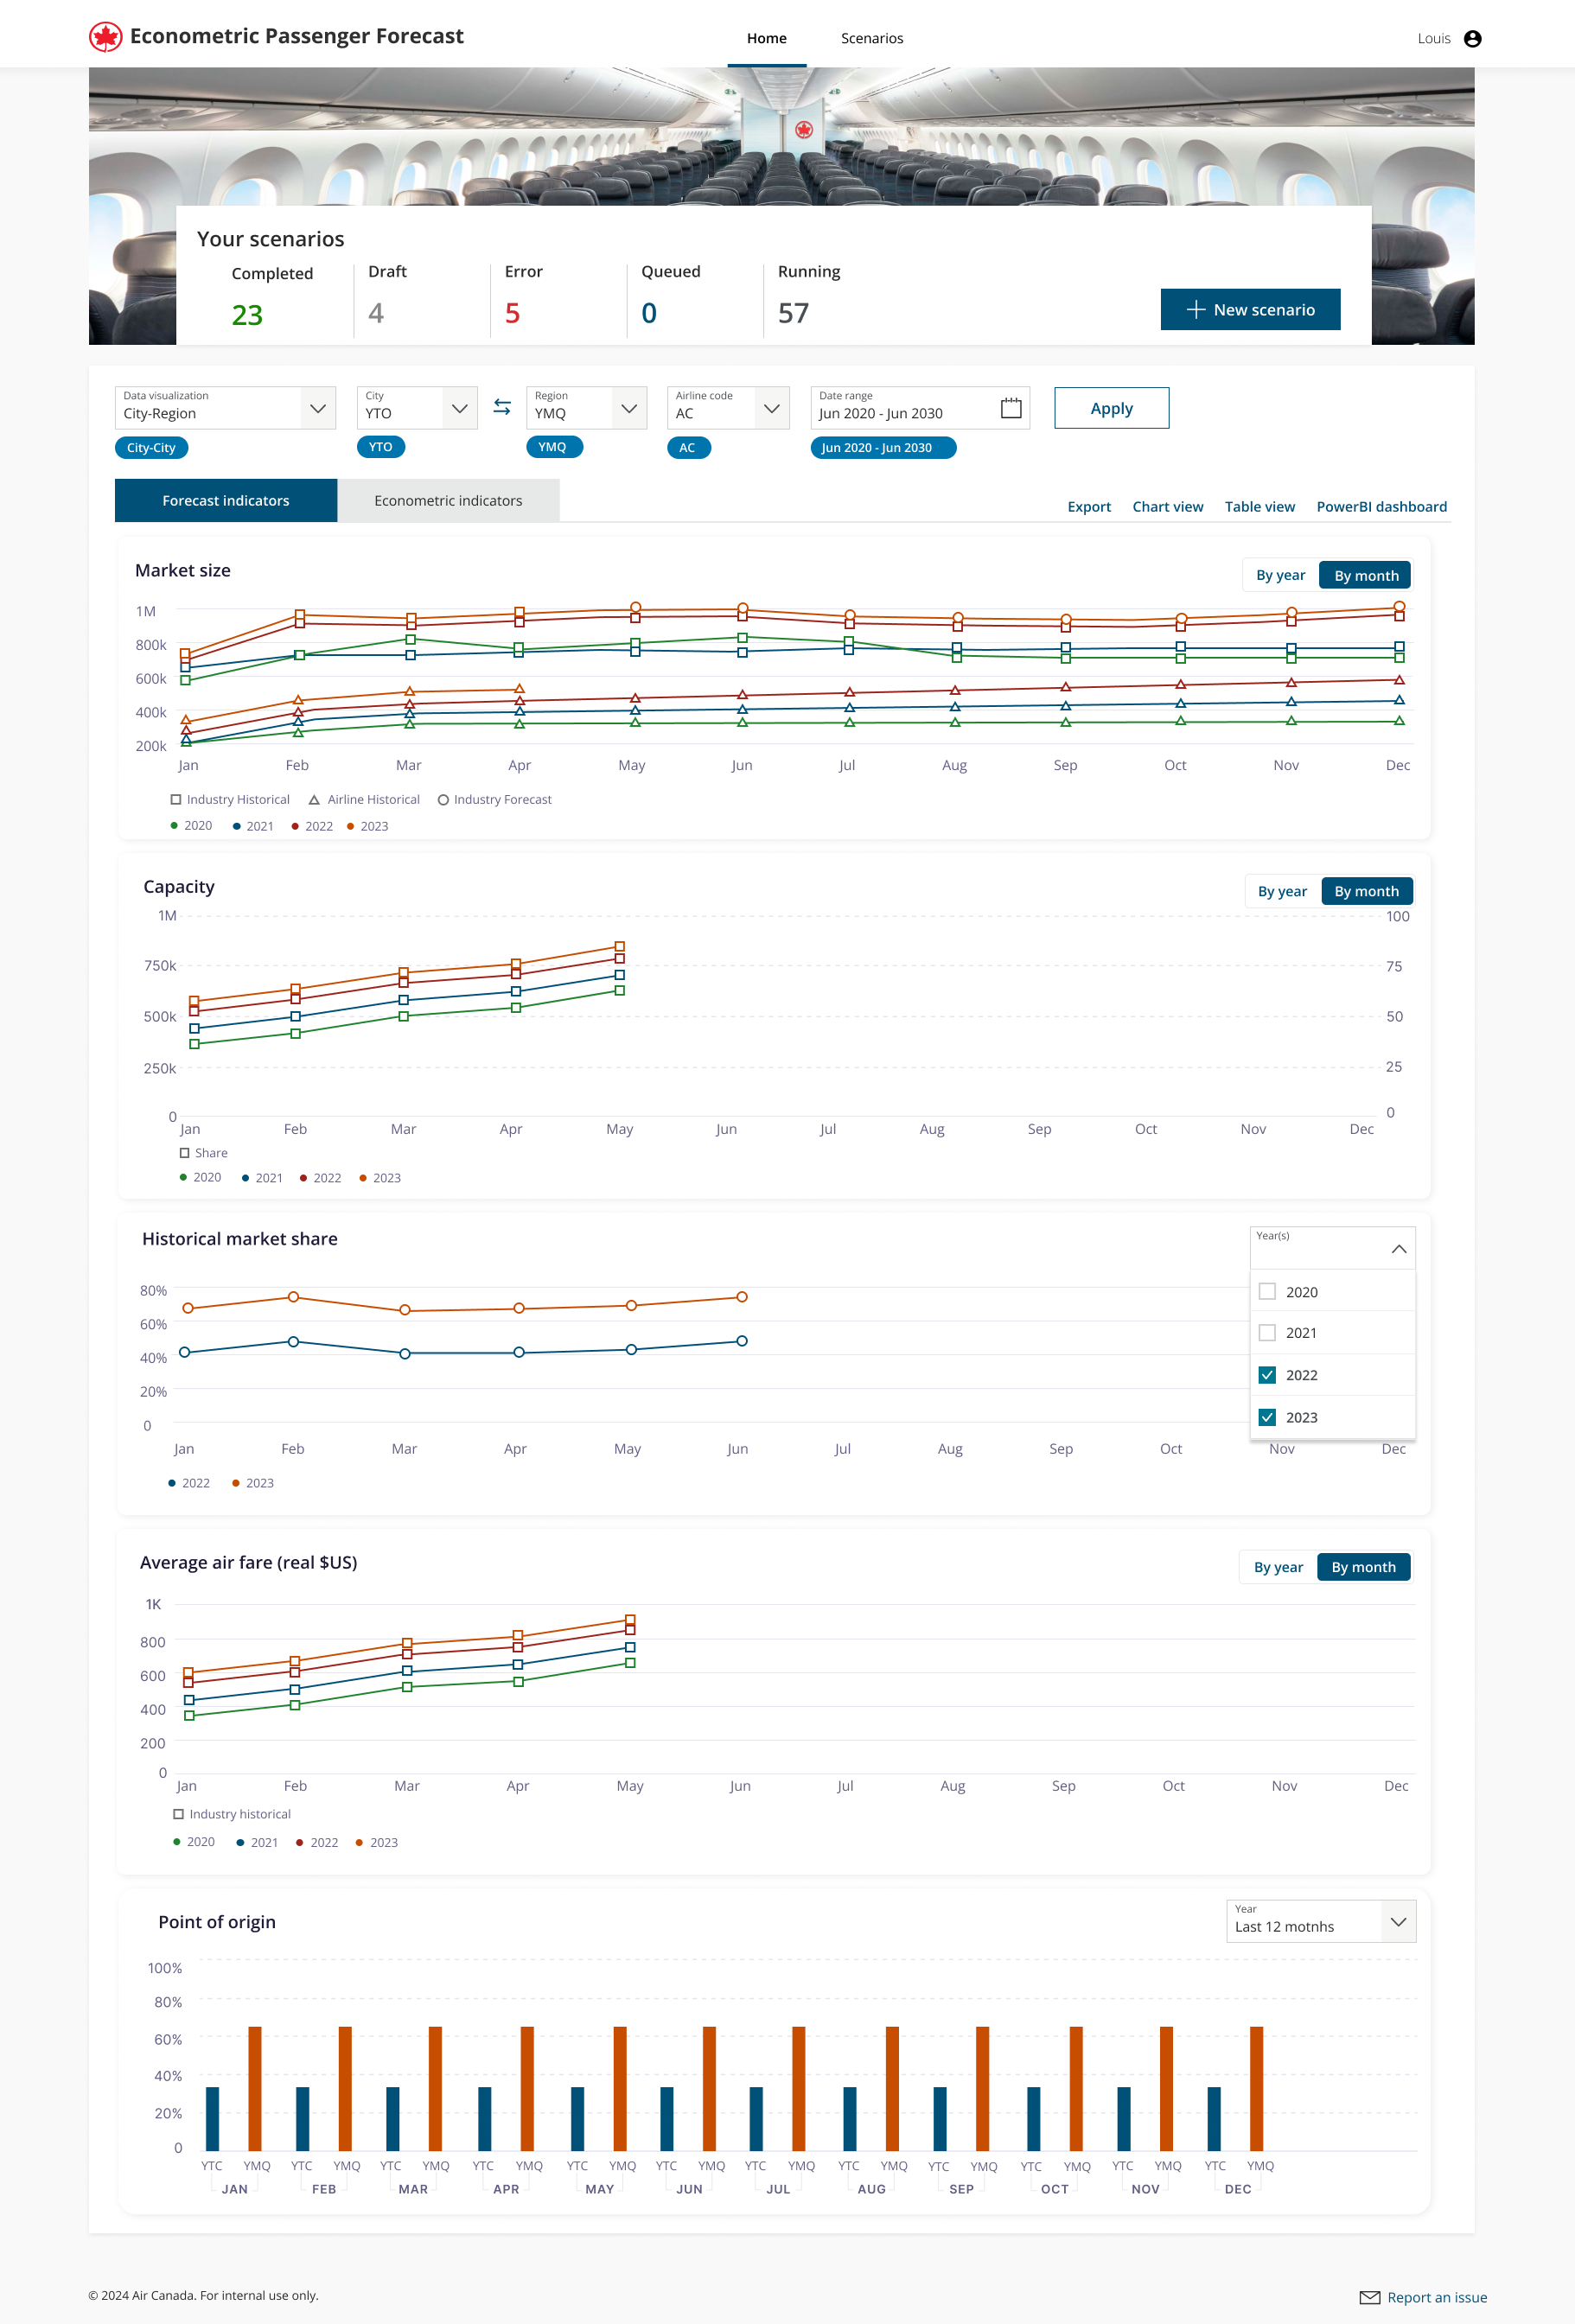
- Designed data visualization dashboards showing projected load factors, yield, and passenger volumes by route, region, and season.
- Introduced interactive filters and sliders to adjust key econometric variables (fuel cost, GDP, FX rates, etc.) and visualize impact in real time.
- Created confidence bands and scenario comparison charts to communicate uncertainty ranges and sensitivity analysis results.
- Developed “forecast insight cards”, micro-summaries translating model outputs into plain-language insights (“A 3% GDP drop is expected to reduce transatlantic passenger volume by 5%”).
- Integrated explainable AI (XAI) patterns, showing key drivers of model predictions to improve trust.
- Applied Air Canada’s design system for consistency and accessibility, using color-blind-safe palettes and high-contrast typography for data-heavy screens.
4. Accessibility & Testing
- Applied WCAG 2.1 AA compliance standards for data visualization accessibility.
- Conducted usability tests with analysts and planners using simulated forecasting data, iterating to simplify navigation and labeling.
- Ensured compatibility with both desktop and large-format operations center displays for collaborative planning sessions.
5. Collaboration & Delivery
- Worked within Agile sprints in Azure DevOps with data scientists, developers, and business stakeholders.
- Translated design decisions into user stories, acceptance criteria, and visualization guidelines.
- Documented an extensible data visualization design framework for future forecasting tools (cargo, maintenance, and operations).
Outcomes & Impact
| Impact Area | Result |
|---|---|
| Forecast accuracy visibility | Improved interpretability of ML model predictions across departments |
| Decision speed | Reduced forecast review time by 40% via interactive visual exploration |
| Trust in AI | Increased adoption of econometric tools by non-technical users (+35%) |
| Collaboration | Enabled shared scenario planning across revenue management and network teams |
| Accessibility | Full WCAG 2.1 AA compliance achieved |
